Best Buy APEX
ML Testing & Data Monitoring System


System Context
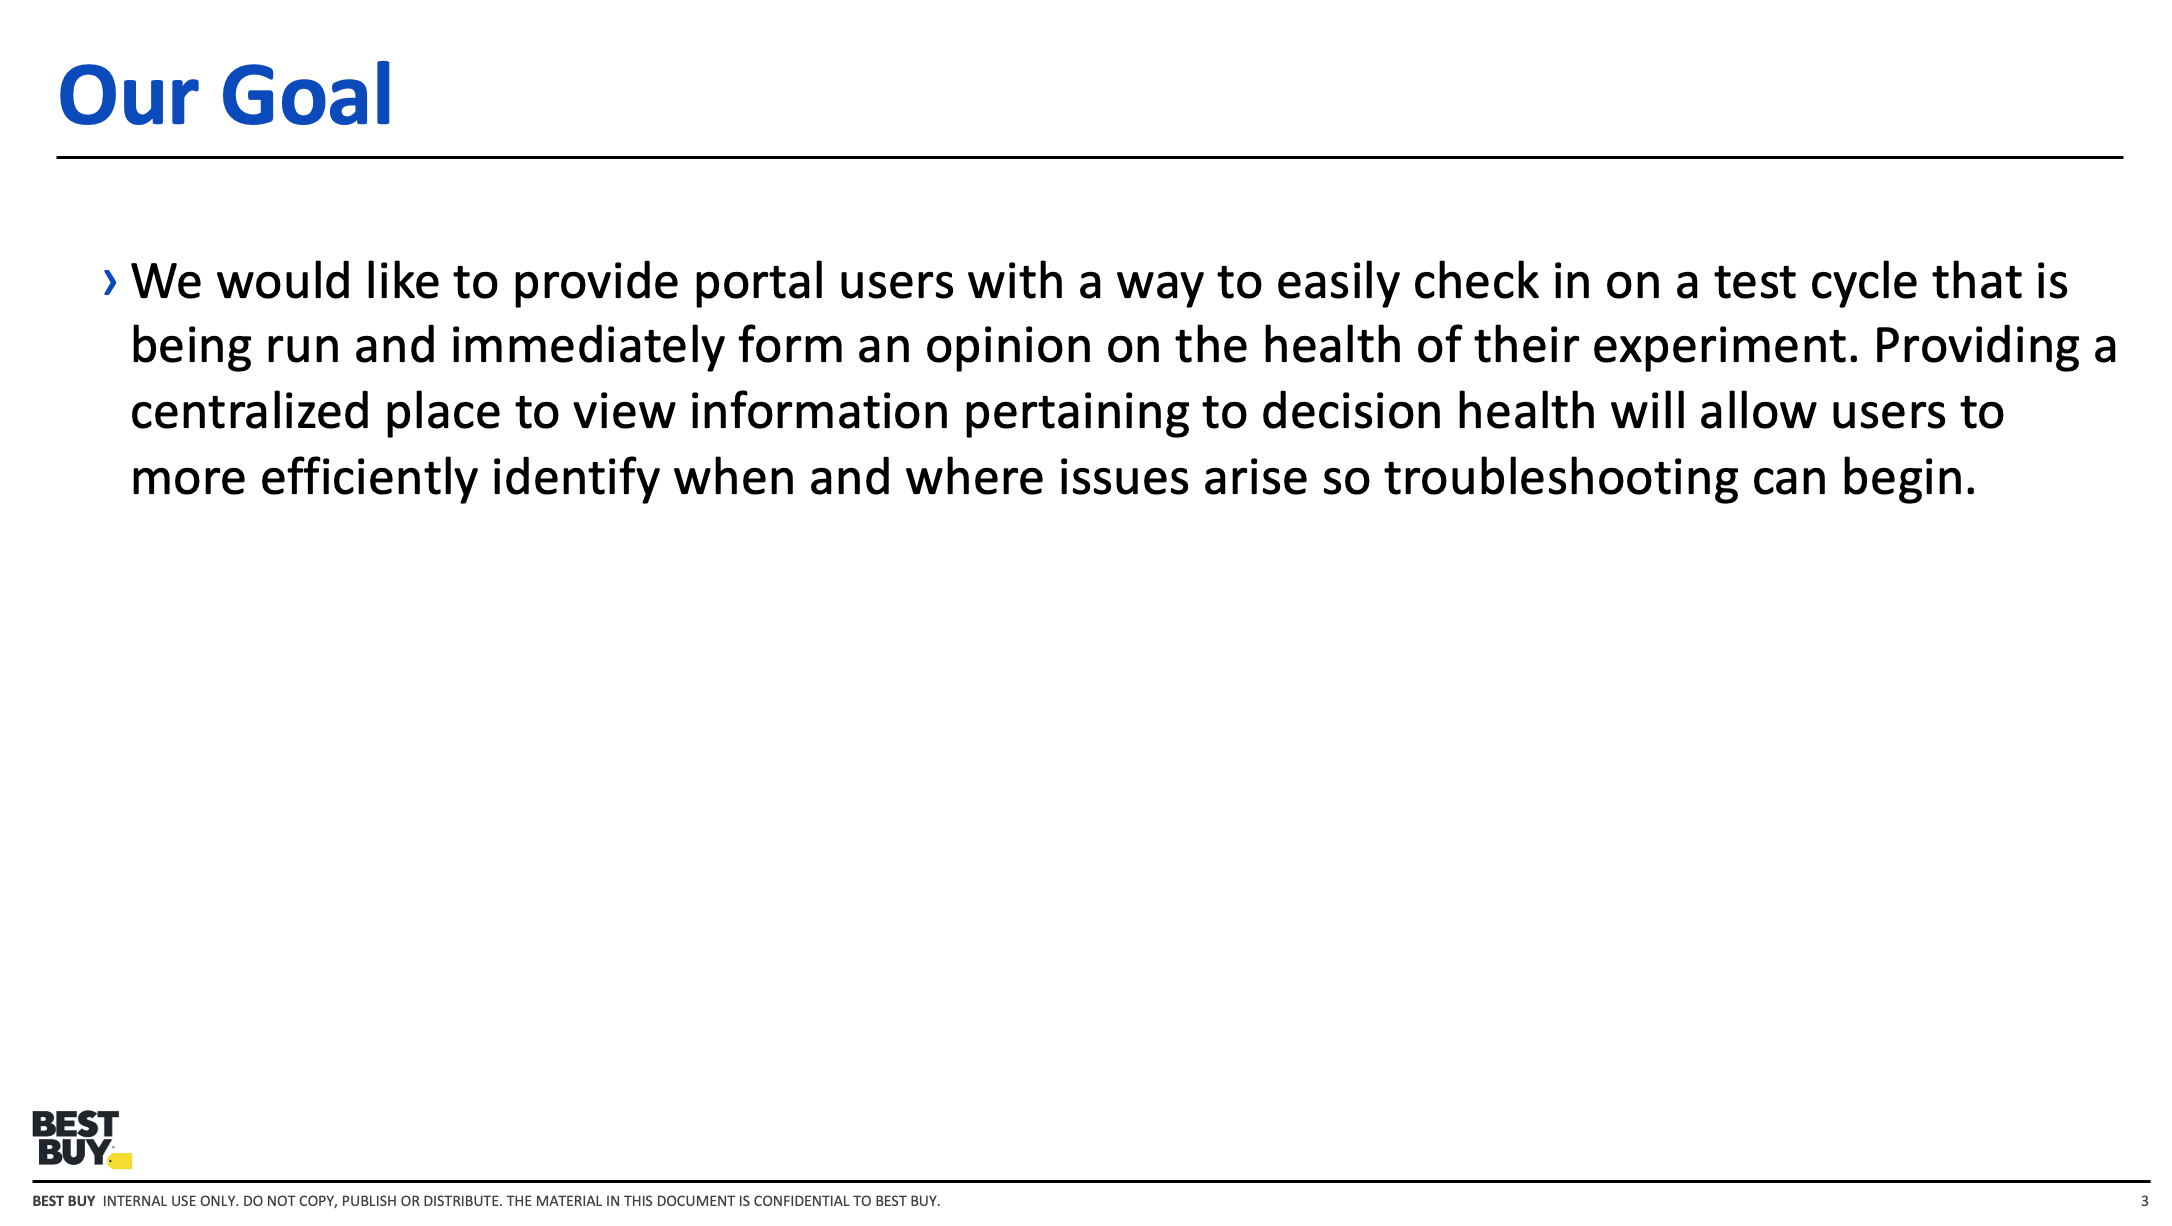
APEX was Best Buy's internal machine learning testing engine, used to evaluate and monitor tests that informed product decisions. A recurring issue was that tests could fail without a clear way for users to identify whether the problem originated in source data, a specific trial, or another part of the pipeline.
The challenge was not simply presenting more information. The system needed to expose the right signals to different users at the right level of detail so they could identify issues quickly and respond without losing days to investigation.
Key Constraints
- Machine learning workflows were technically complex and difficult to monitor
- Different user groups needed different signals and levels of detail
- Data failures were costly and often slow to diagnose
- Monitoring needed to support action, not just reporting
Primary Goals
- Make test health visible earlier in the process
- Surface data issues before they became larger failures
- Create clearer monitoring patterns for developers and data scientists
- Reduce the time needed to identify and respond to issues
Approach
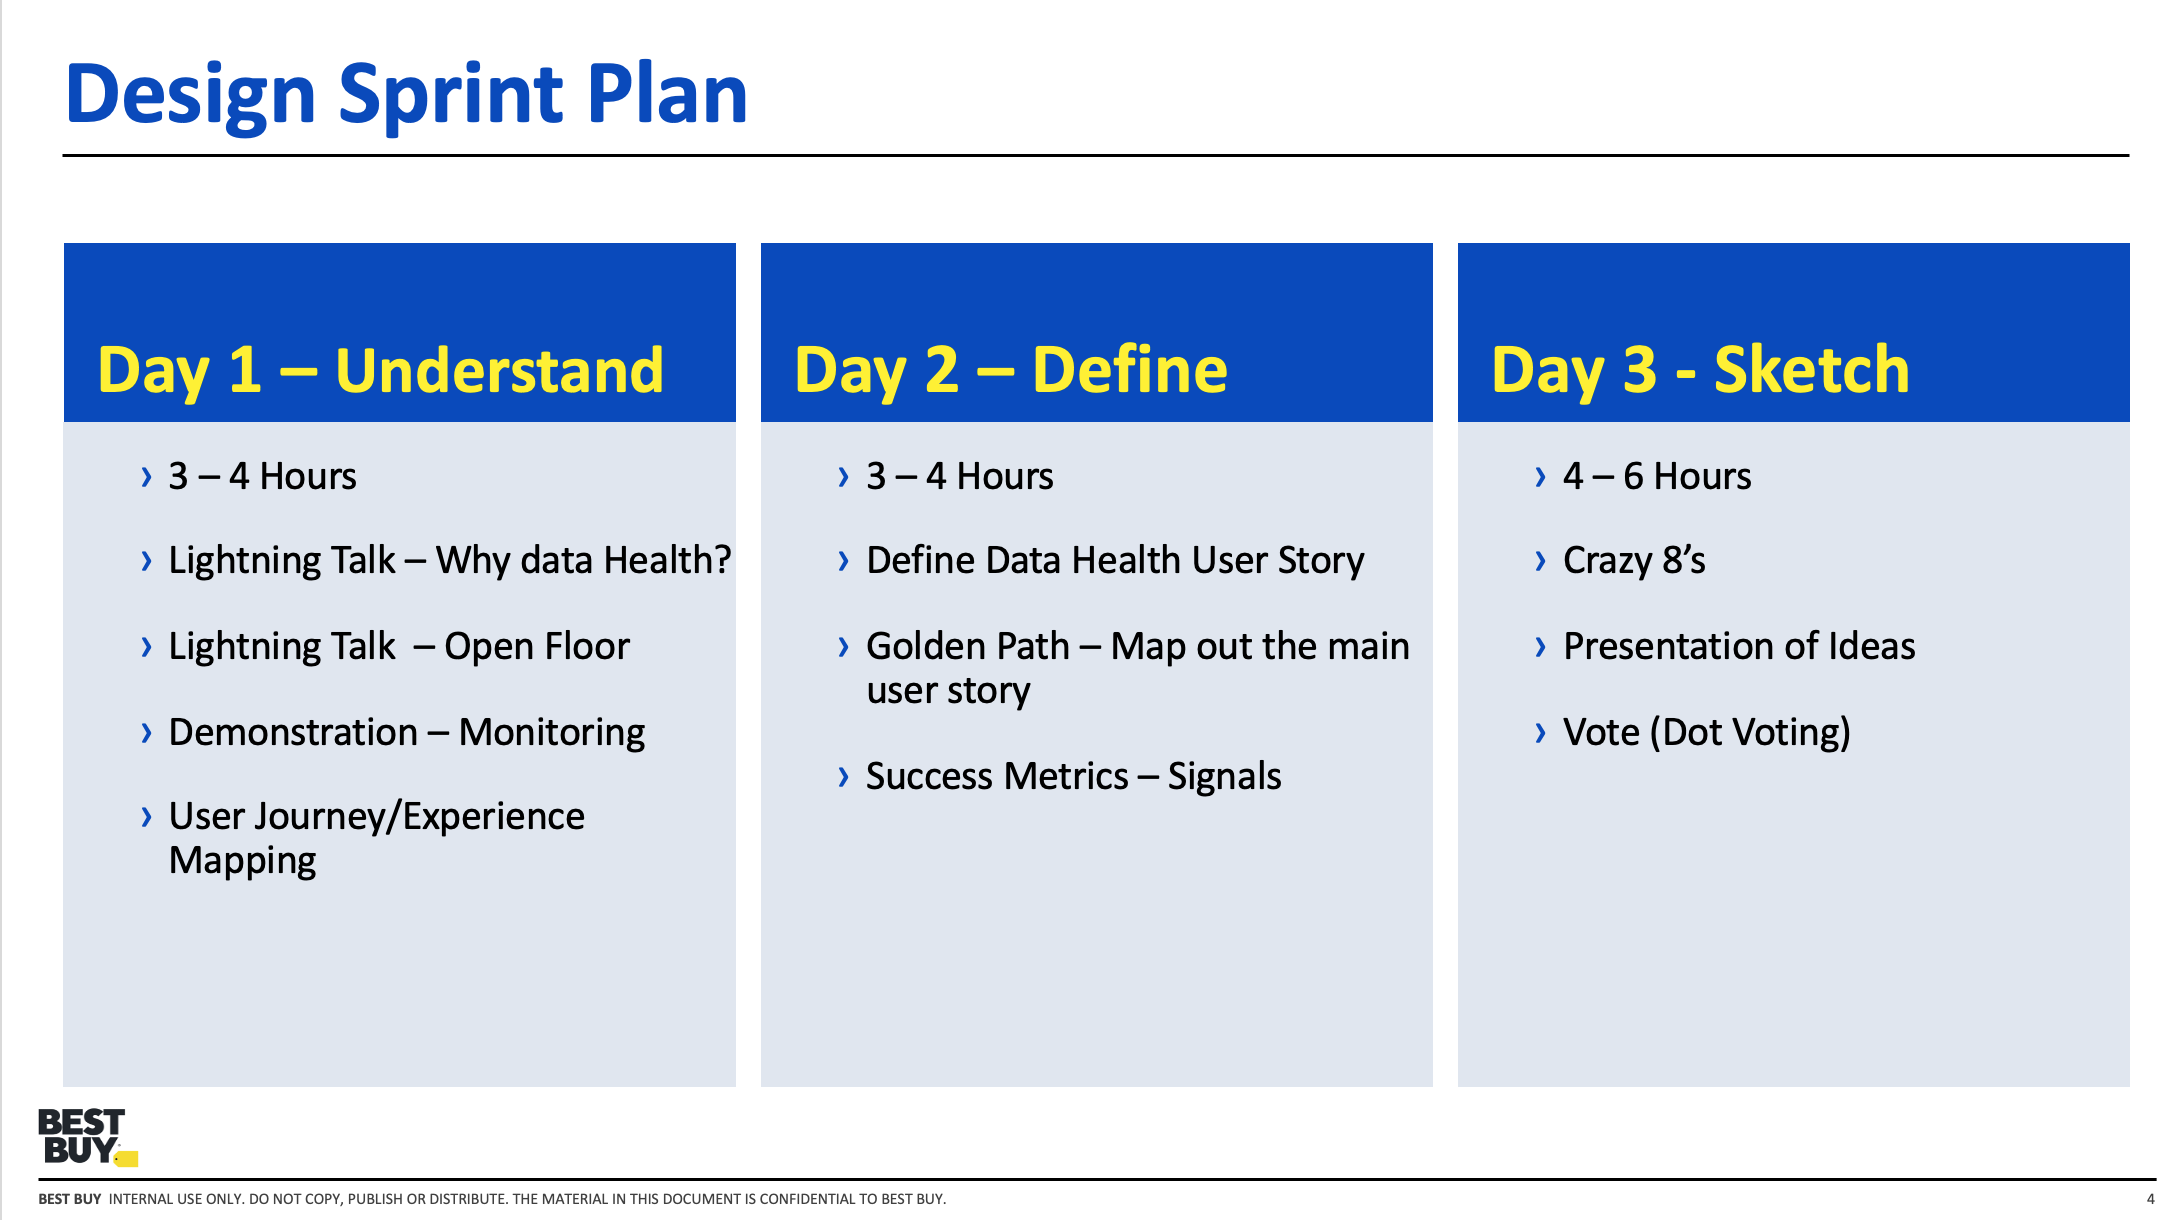
I worked with product, engineering, and data science stakeholders to define how the system should communicate health, risk, and failure states more clearly. The process combined system mapping, collaborative workshops, interface design, and validation with the users closest to the problem.
Rather than treating the work as a visual redesign, the focus was on exposing system state in a way that made diagnosis faster and more actionable.
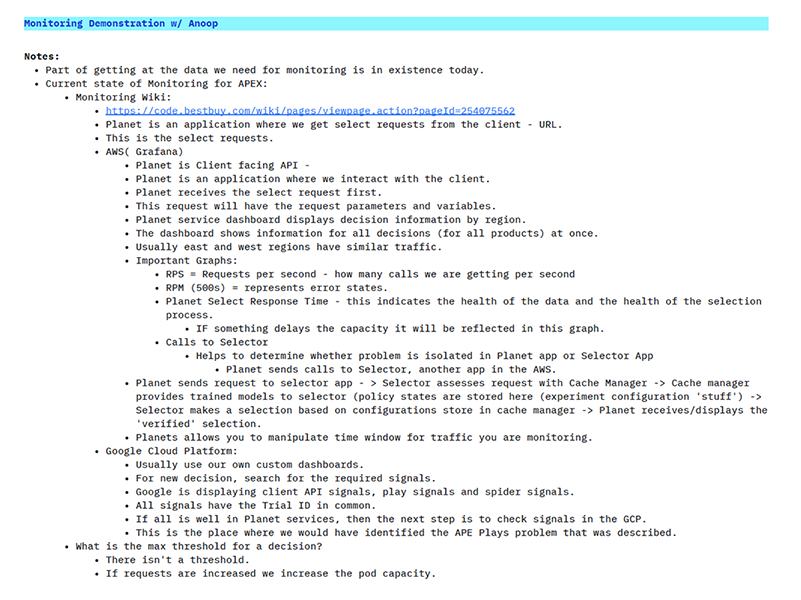
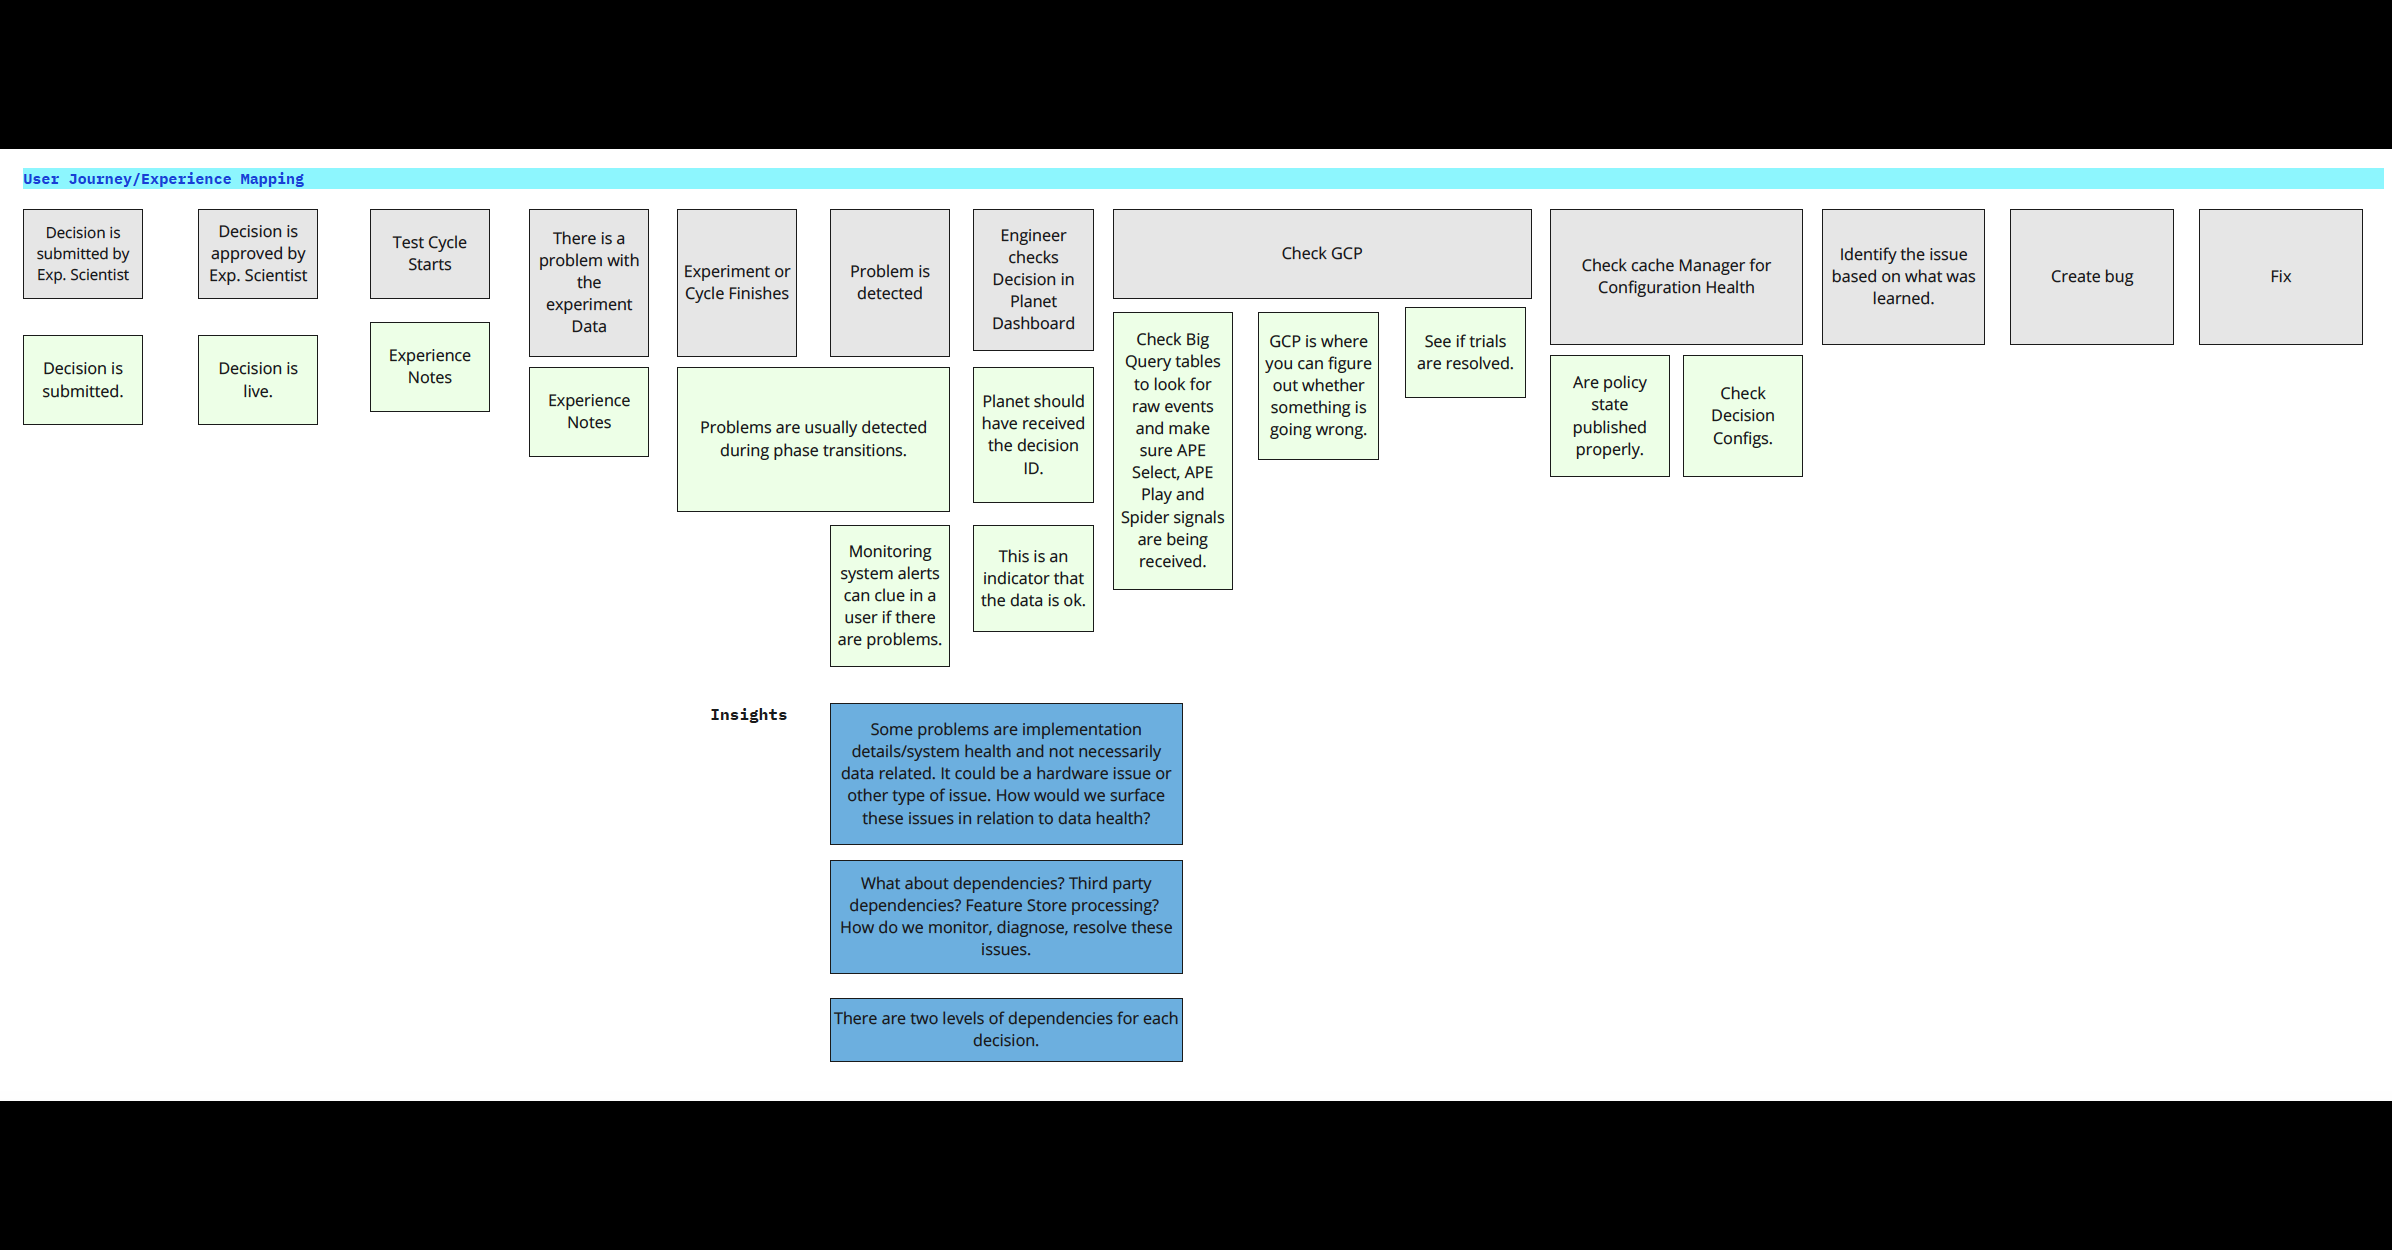
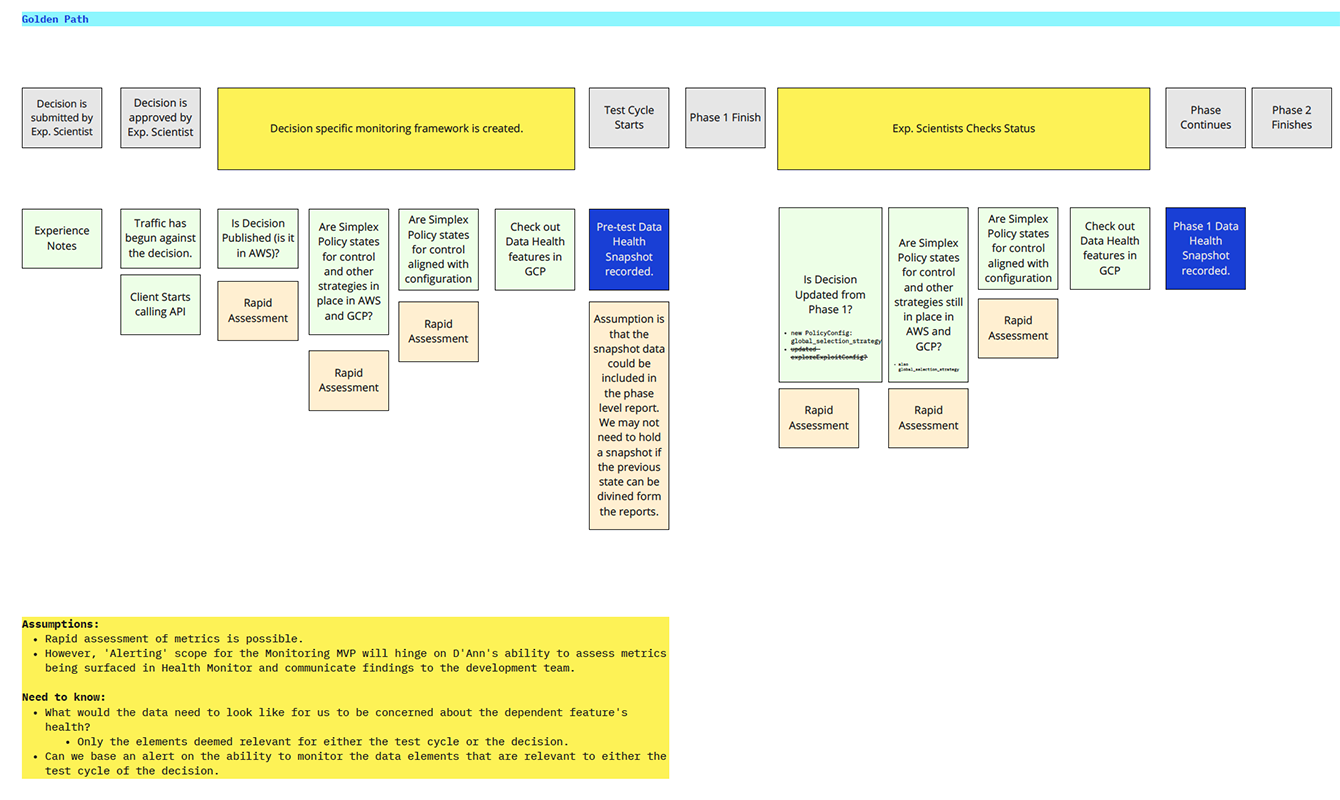
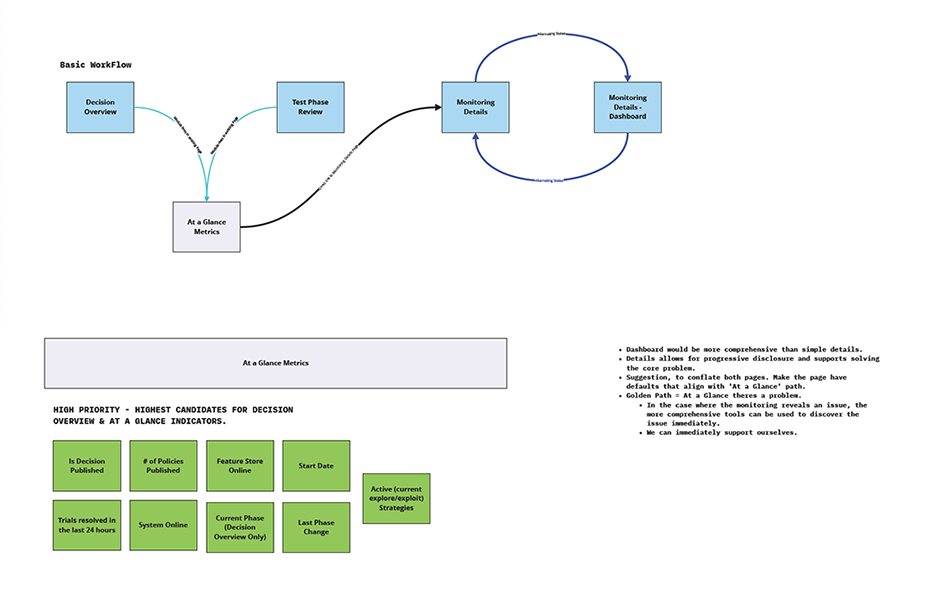
Workflow & Role Mapping
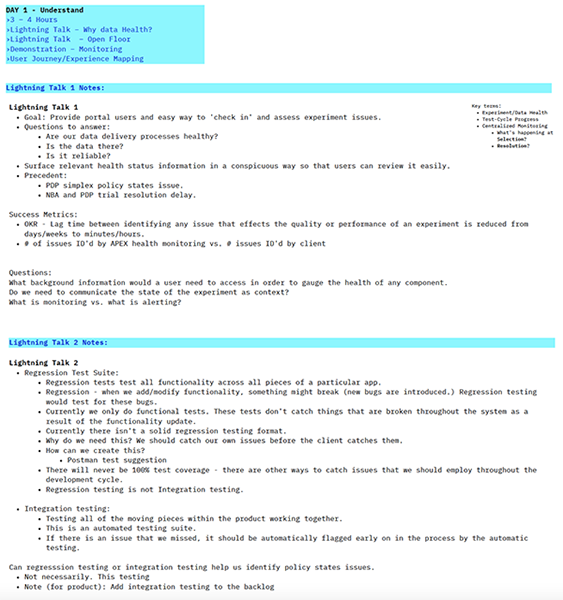
The first step was understanding how different users experienced the testing workflow. Developers, data scientists, and product stakeholders all interacted with the system differently, and each group needed different forms of visibility. I facilitated mapping exercises to capture the current workflow, identify where confusion emerged, and define what "healthy" and "at risk" meant for each audience.
This work revealed that the problem was not only one of monitoring, but of role-based interpretation. The system needed to support quick triage for some users and deeper analysis for others.
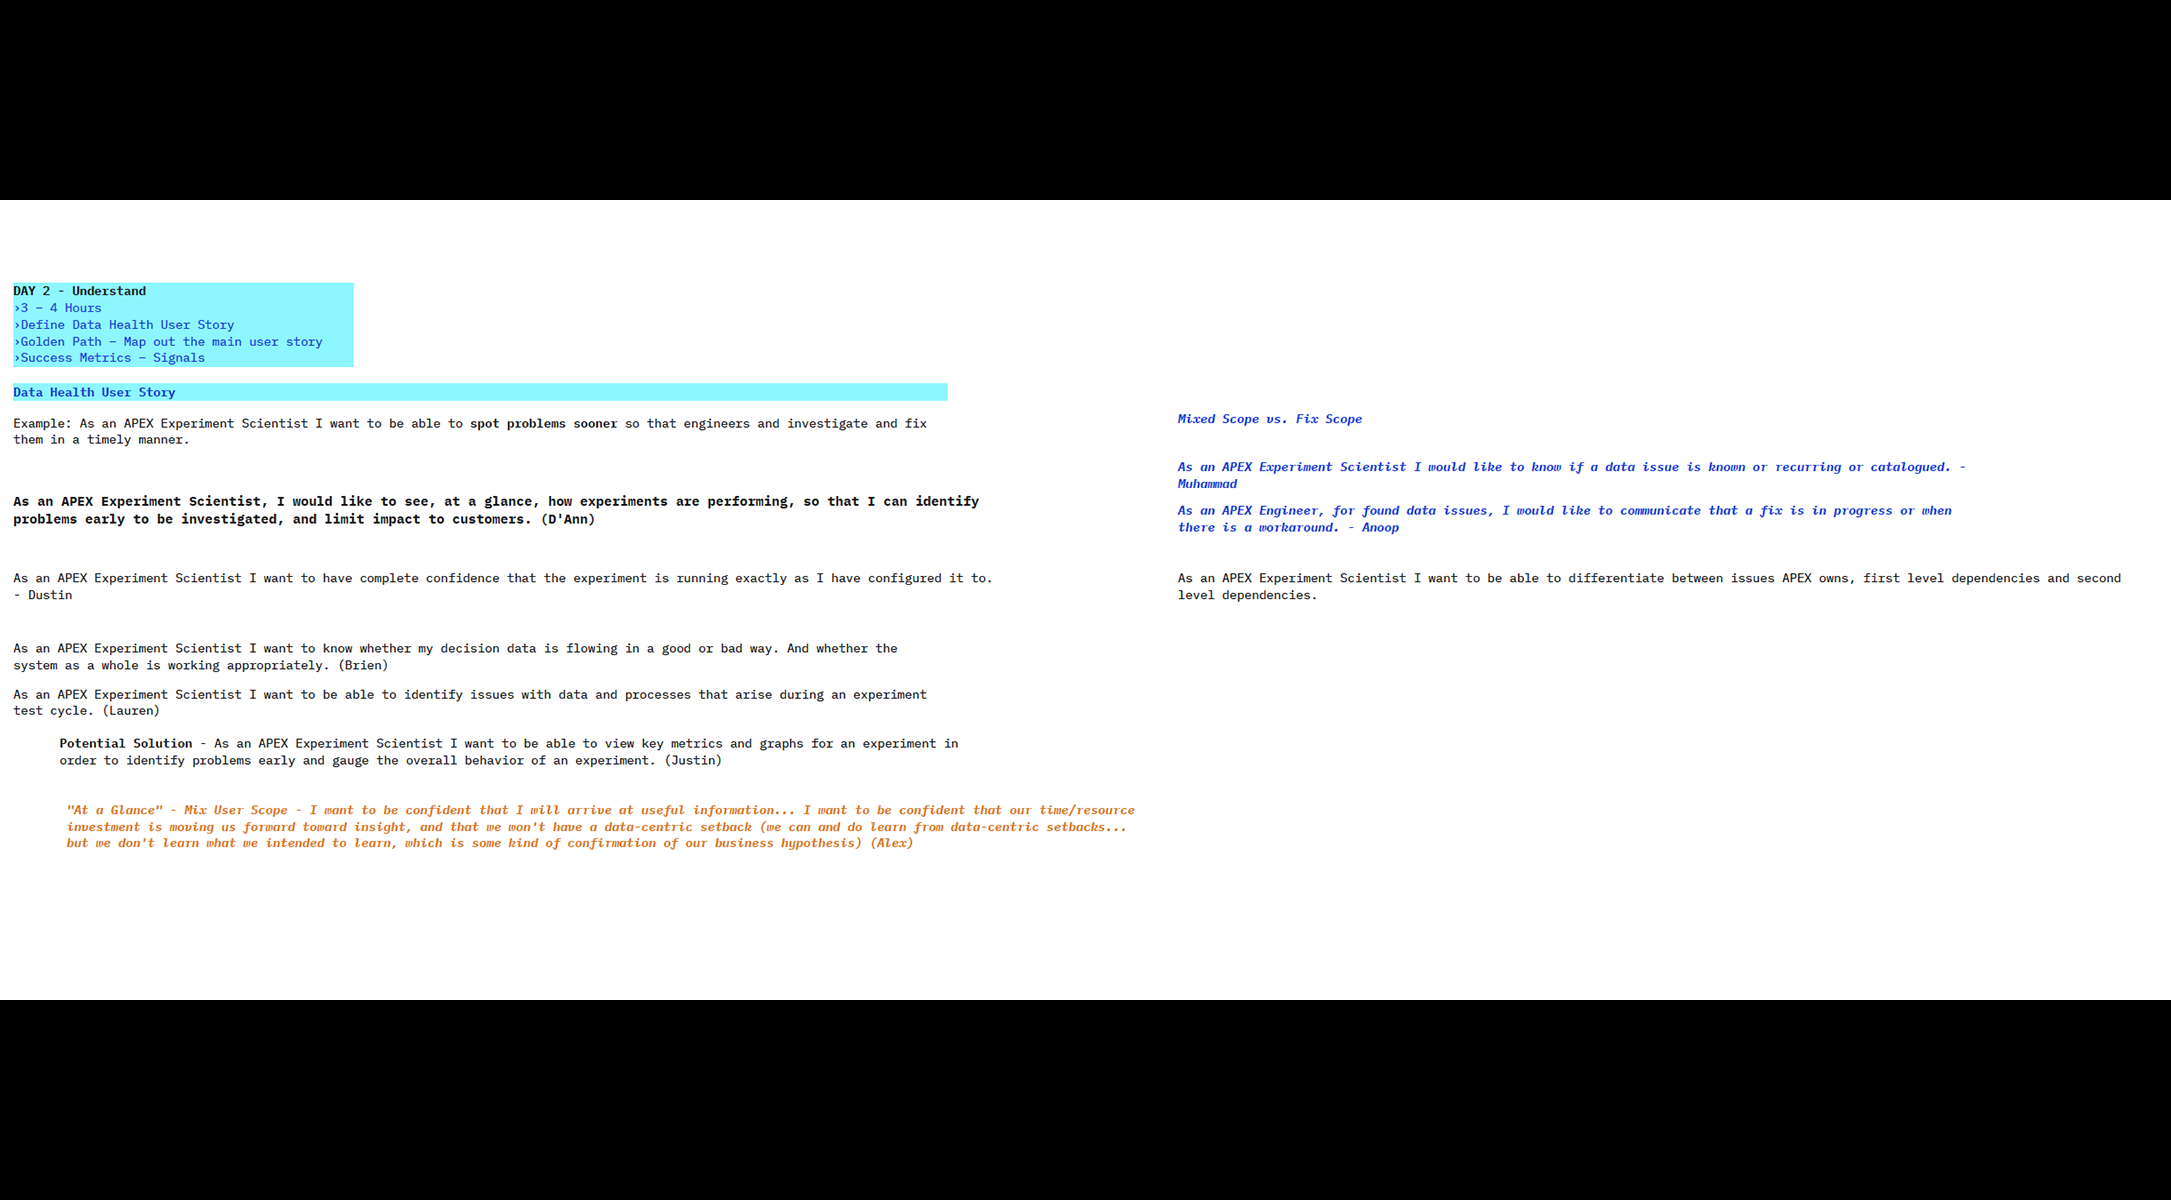
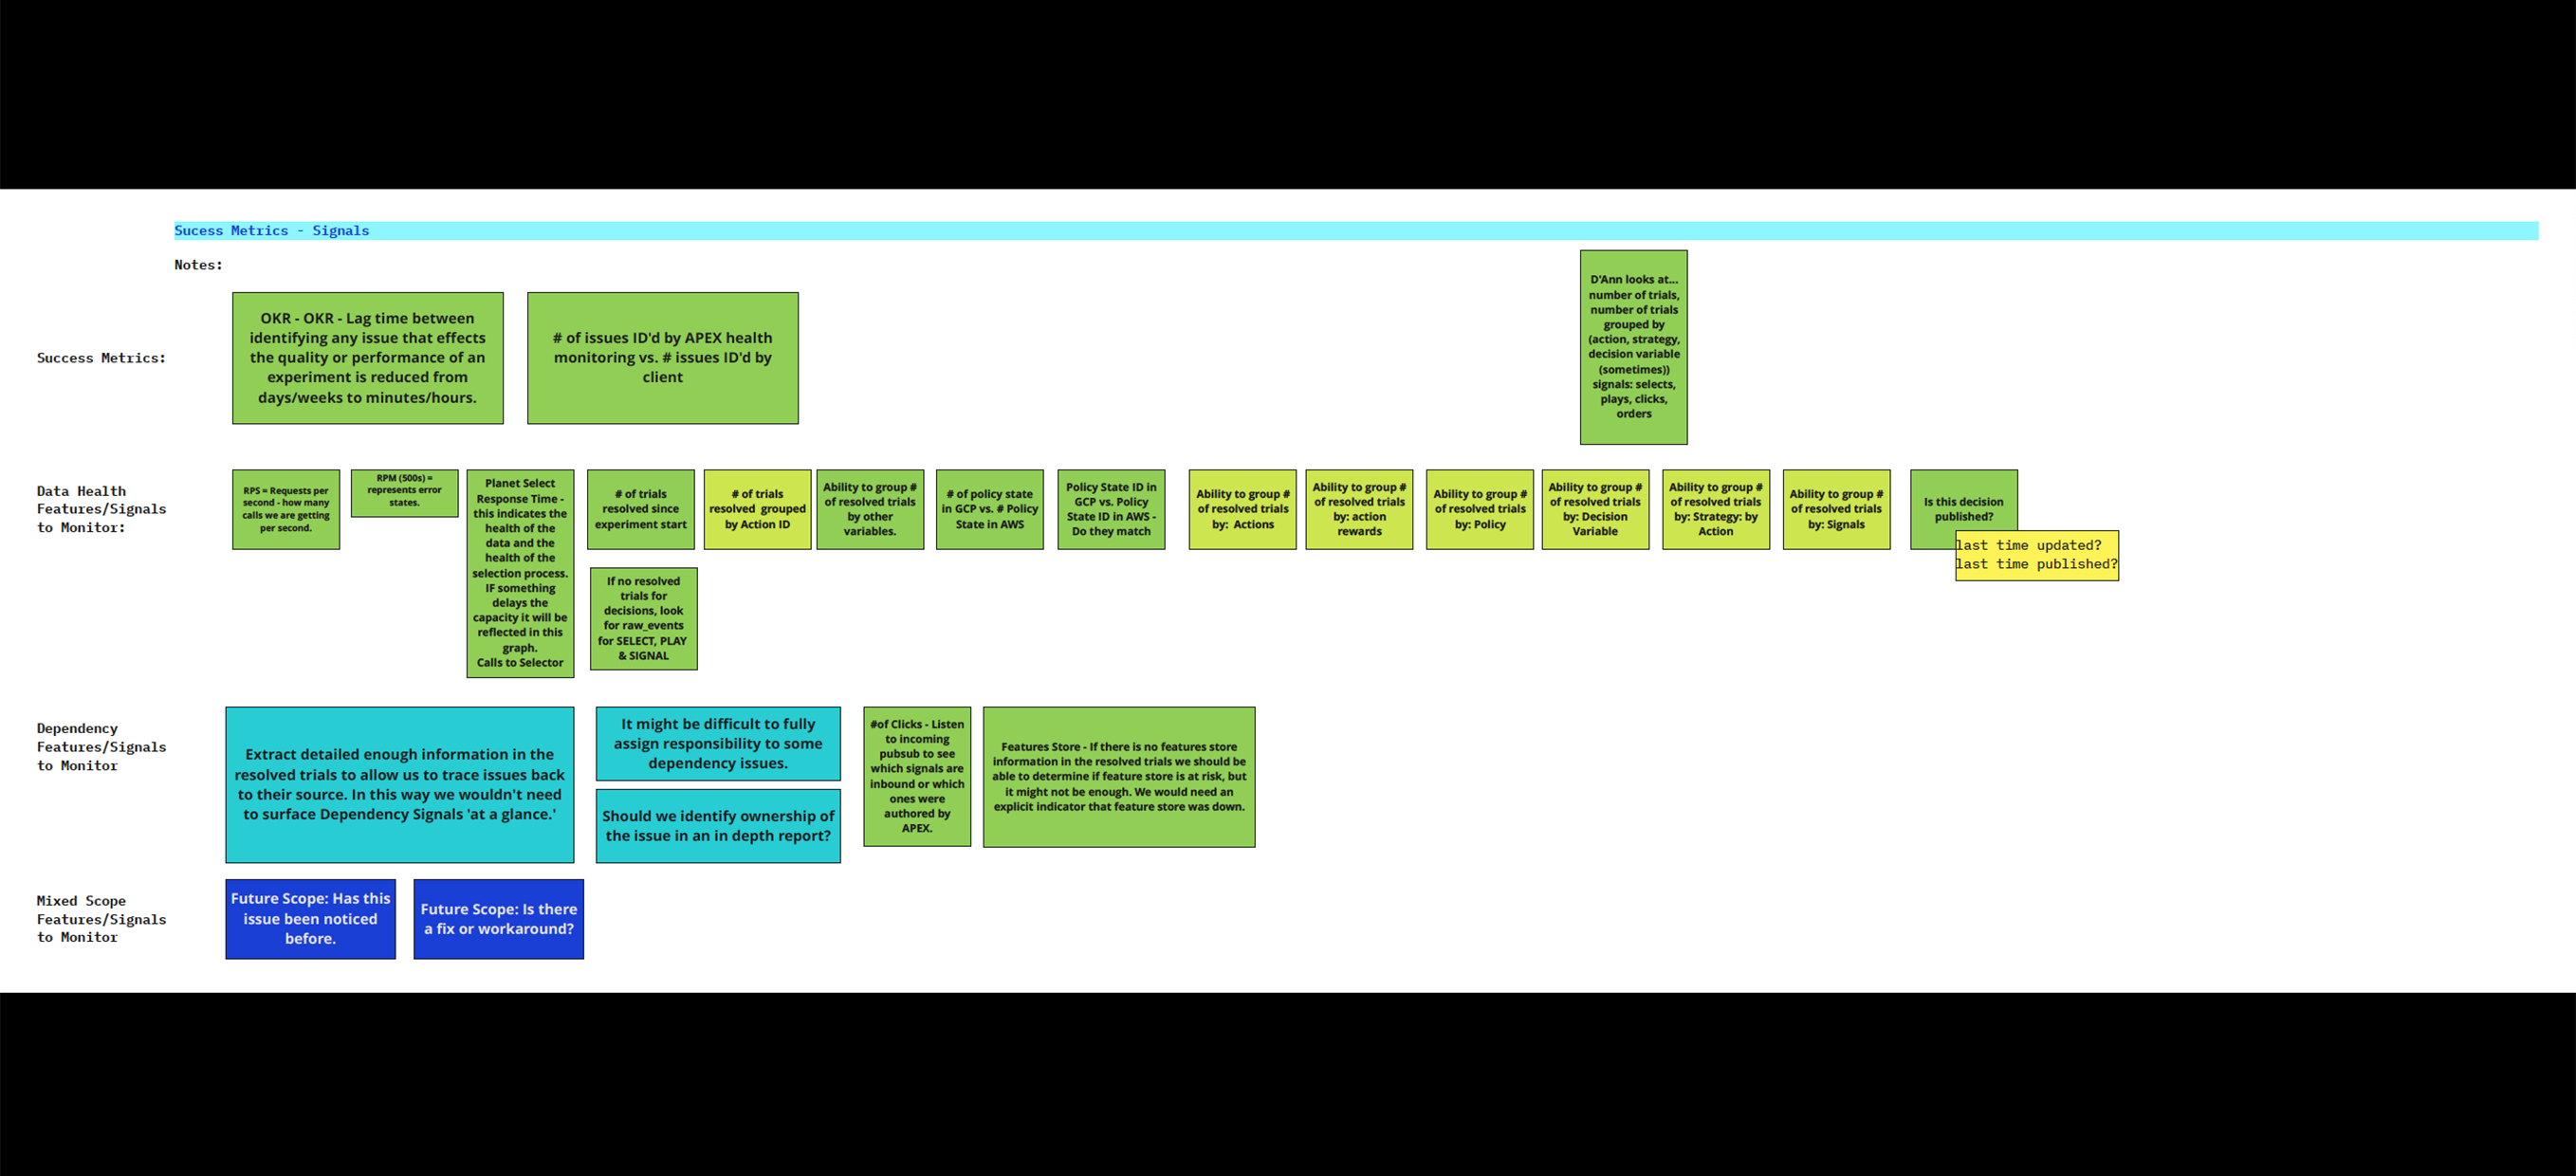
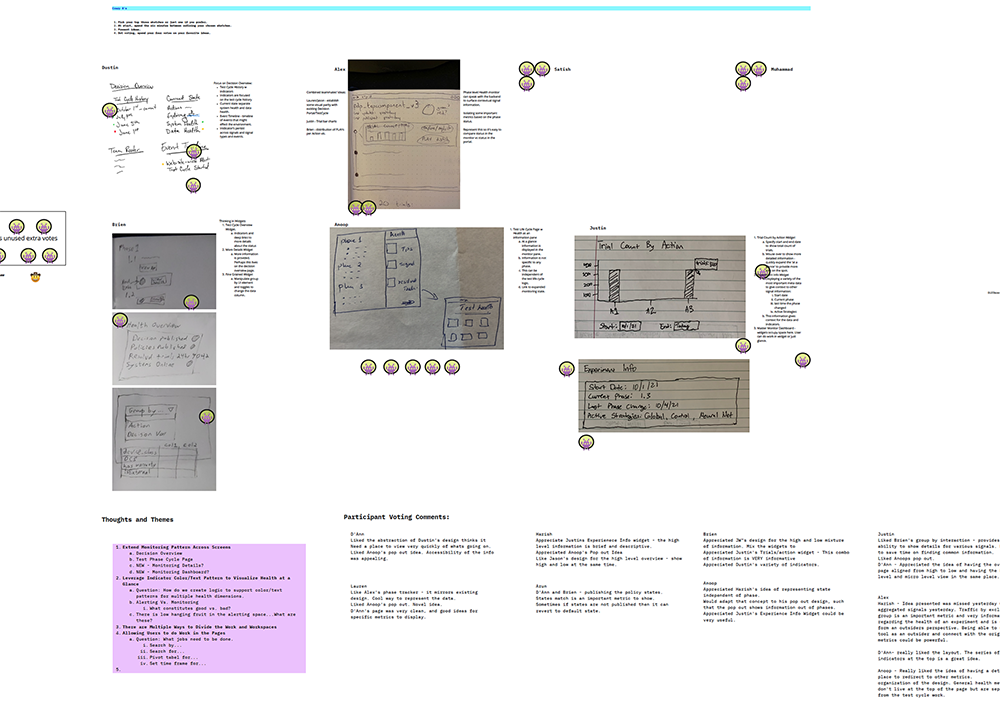
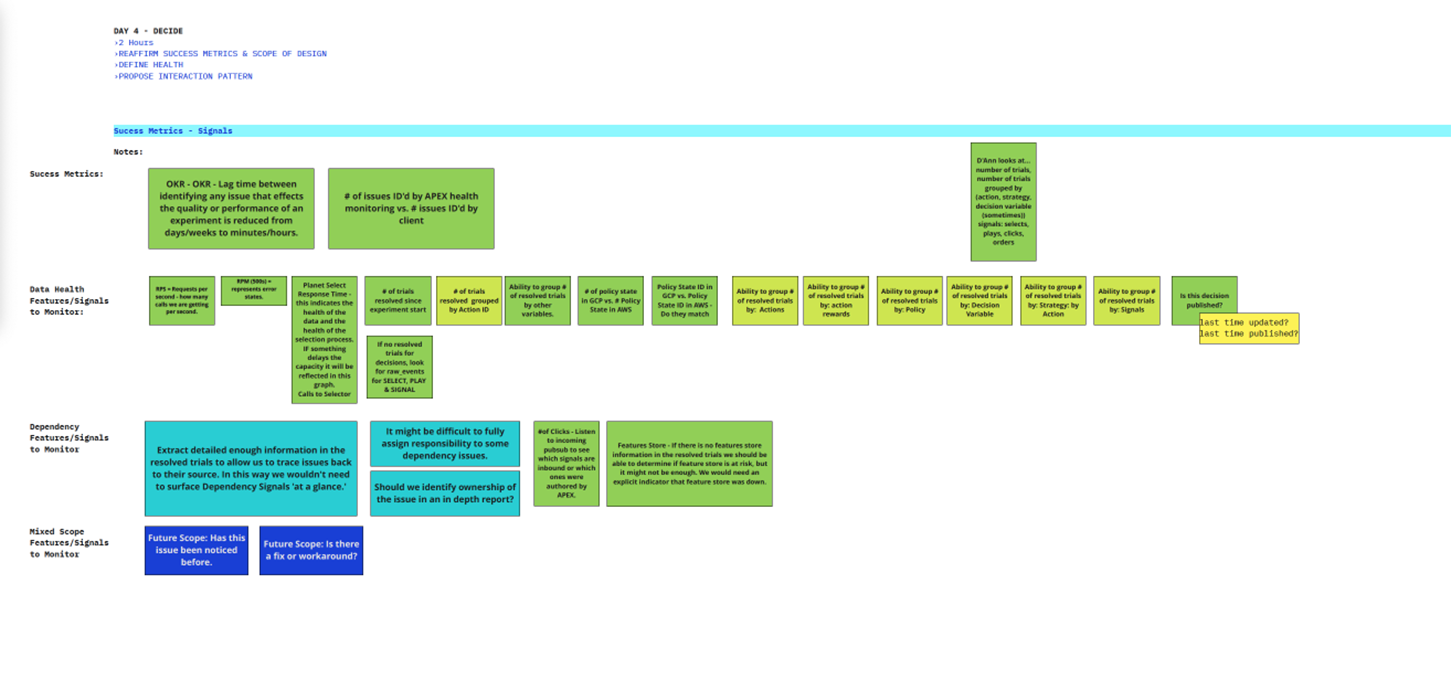
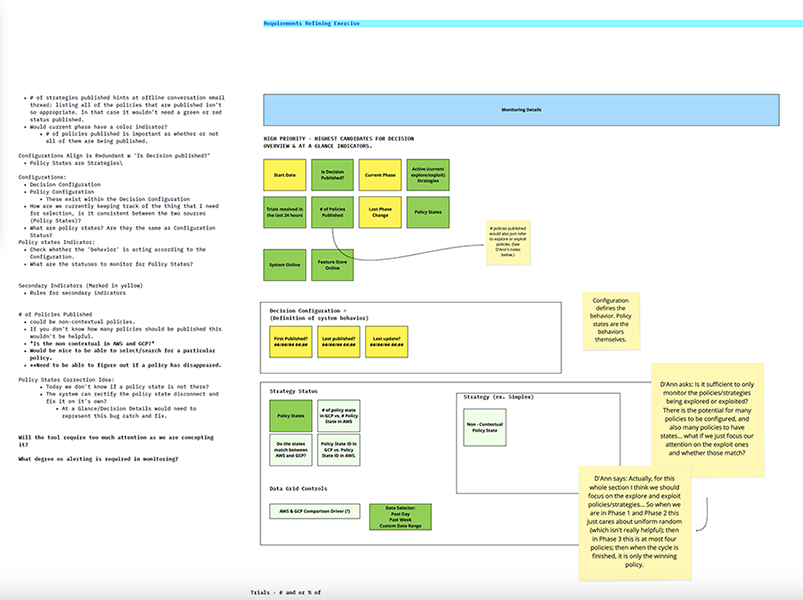
Data Visibility & Prioritization
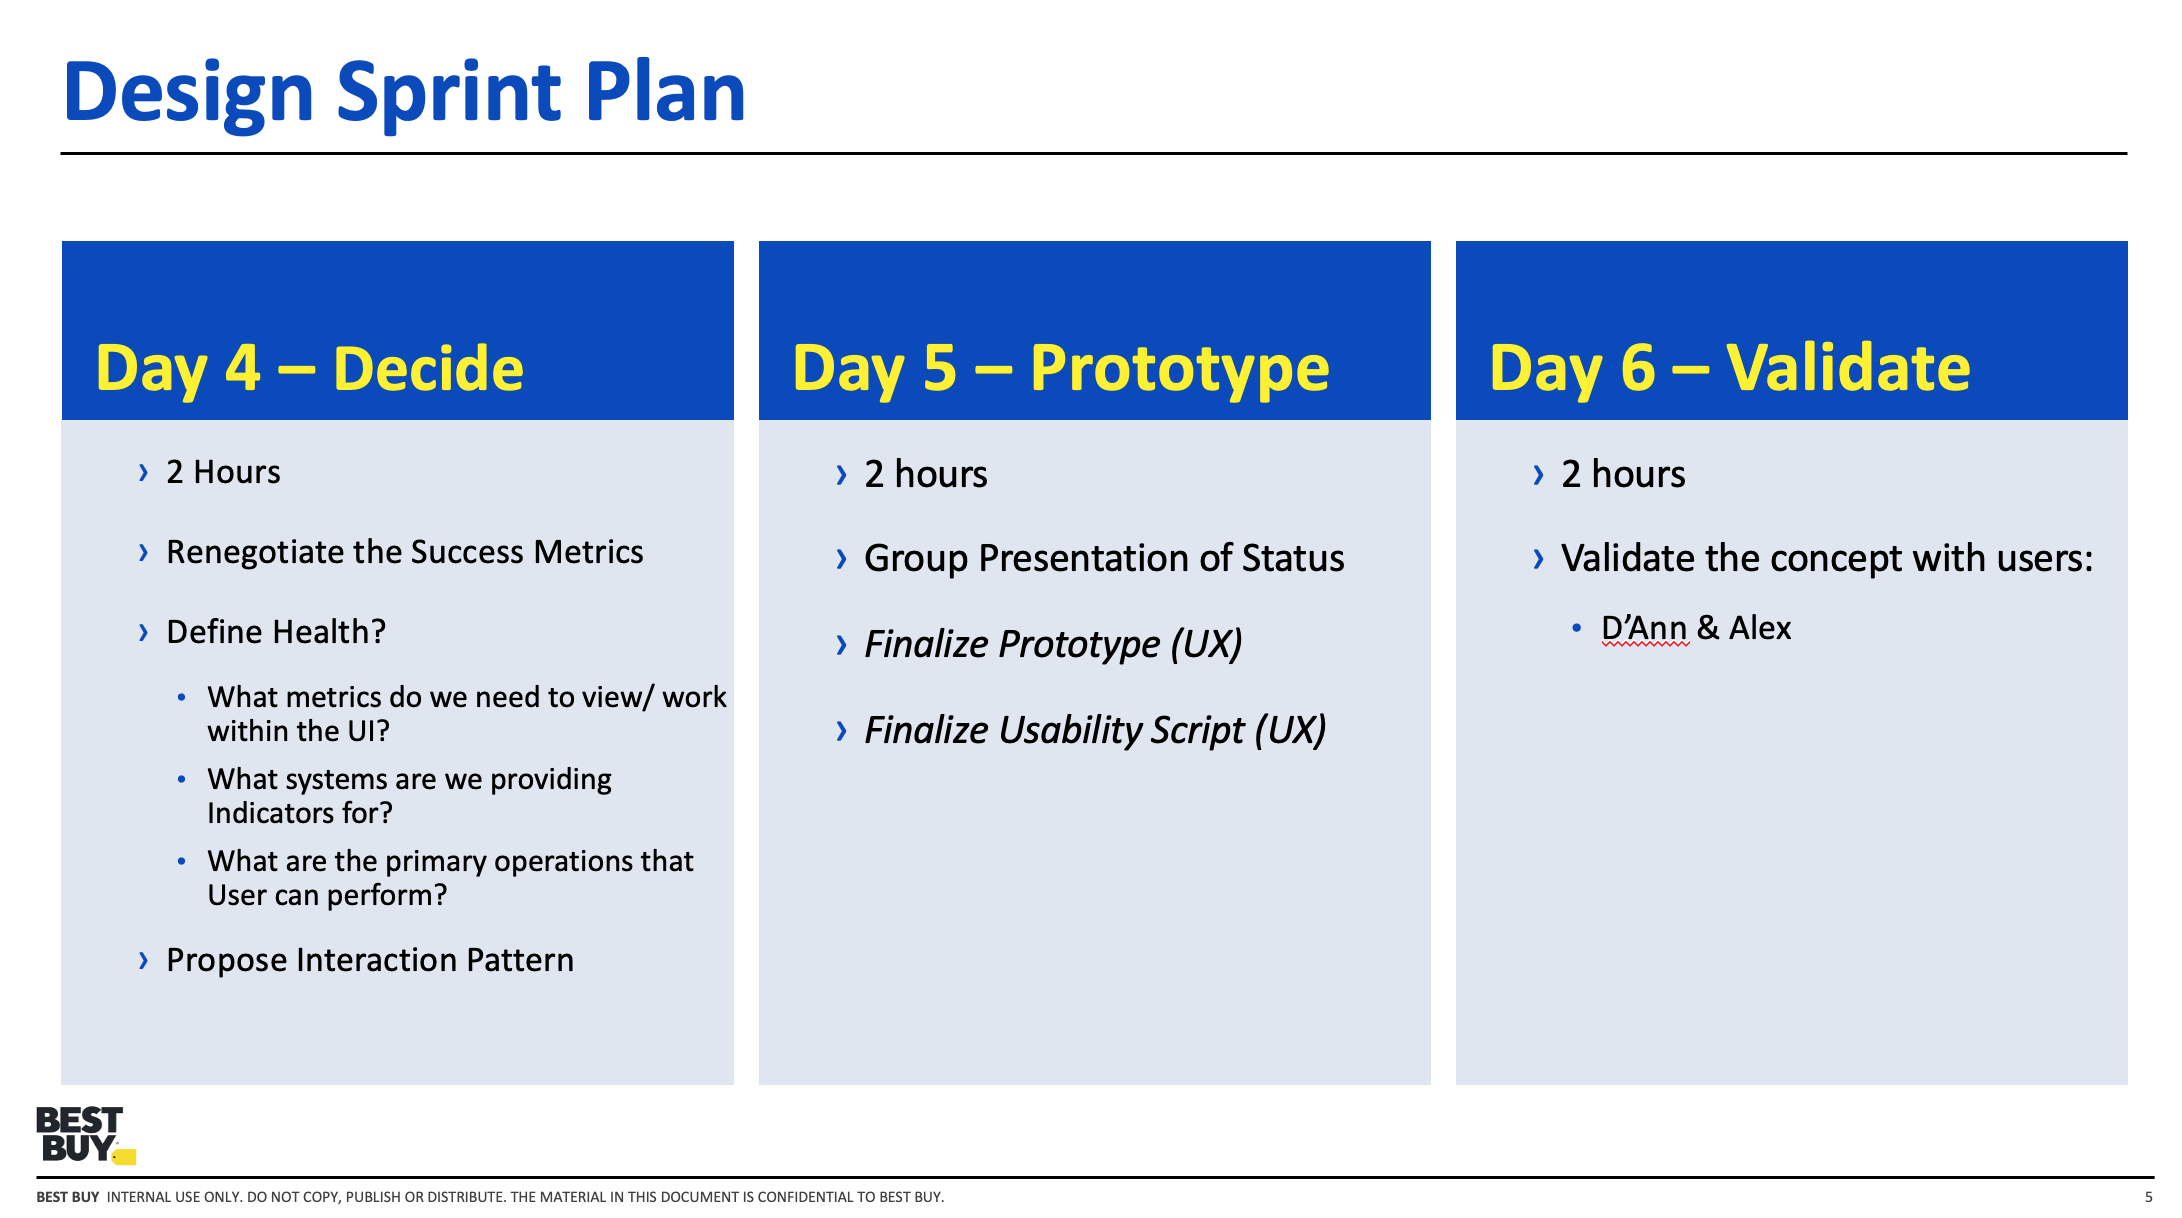
Once the workflow was clear, the next challenge was deciding which metrics mattered most, when they should appear, and for whom. I helped the team define success signals, identify critical monitoring thresholds, and structure a hierarchy of information that balanced quick status checks with deeper diagnostic detail.
This phase was especially important because user roles had different definitions of data health. The monitoring system needed to account for those differences without fragmenting the experience.
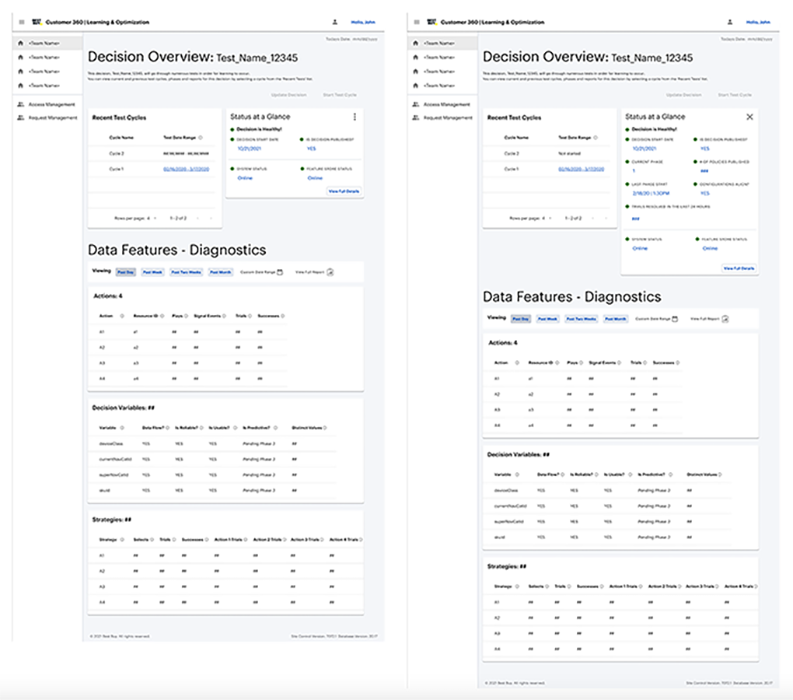
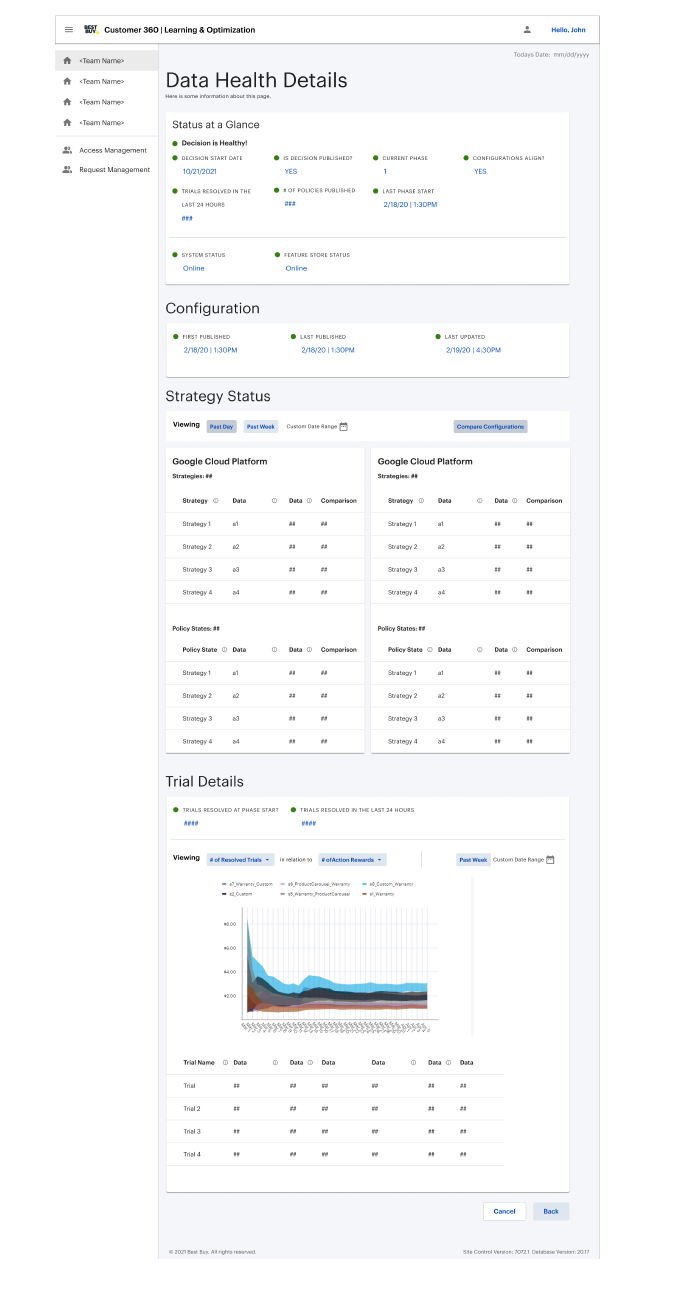
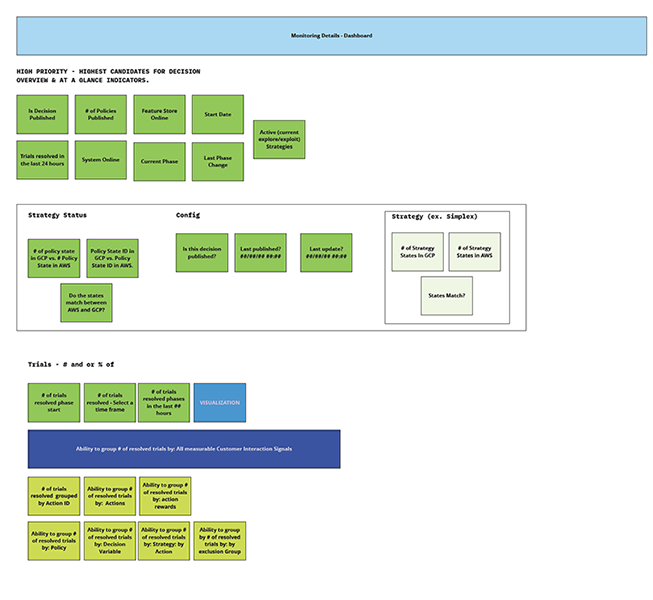
Monitoring System Design
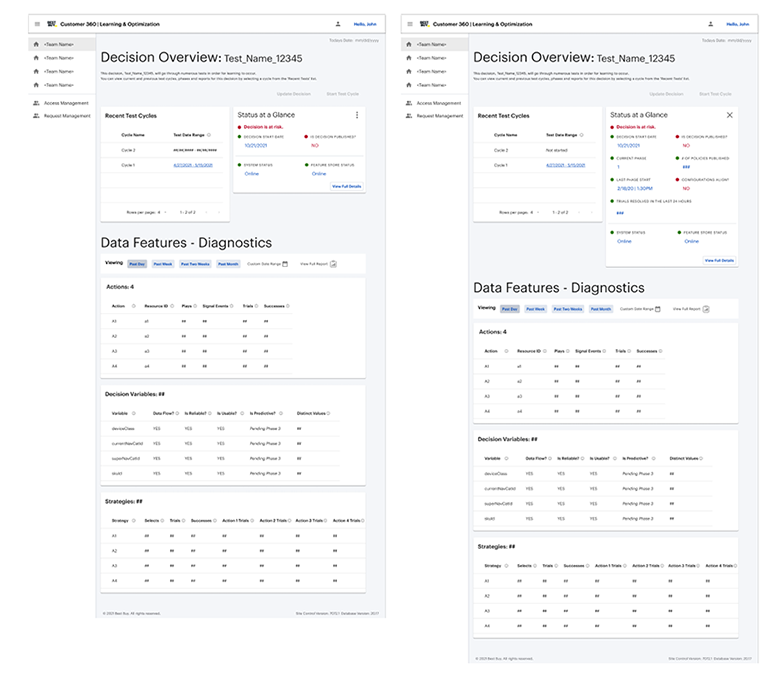
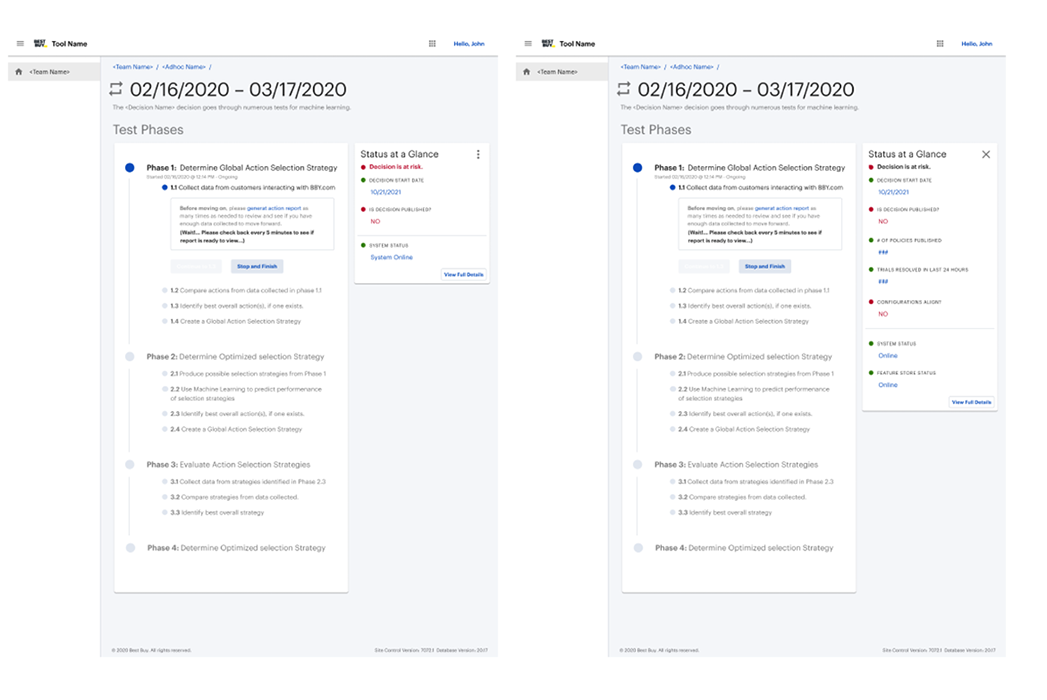
The resulting concept centered on a "status at a glance" monitoring layer paired with a deeper decision health view. This gave users a fast way to identify whether a test or decision was healthy, at risk, or failing, while also creating a path into more detailed metrics when investigation was needed.
My role here was to turn a technically dense problem into a system of views that reflected urgency, data relationships, and role-based needs without pretending that every user needed the same level of analysis.
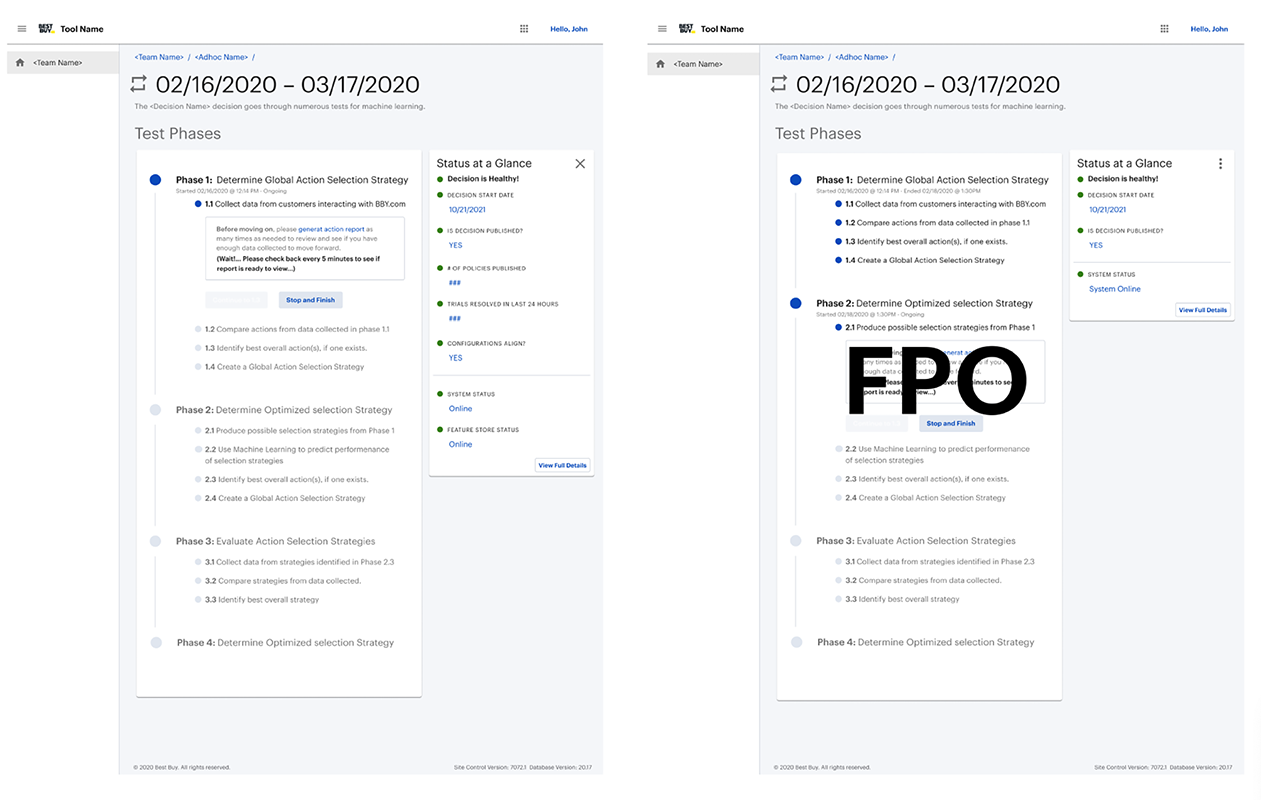
Validation & Refinement
Validation sessions with technical stakeholders confirmed that the monitoring widget was useful for surfacing immediate health signals, while the deeper detail views supported downstream problem-solving. The feedback also reinforced an important segmentation pattern: engineering and data science users needed overlapping but distinct information.
This led to further refinement of information hierarchy, metric groupings, and documentation, helping the team move toward a clearer shared definition of data health.
Impact
The monitoring model helped the team move toward faster issue identification, clearer escalation, and more useful visibility into decision health before full test failures occurred. A key outcome was the "at-a-glance" monitoring layer, which reduced the time needed to identify and respond to important issues from days or weeks to a much shorter operational window.
Just as importantly, the work created a clearer foundation for how machine learning workflow health could be communicated across roles inside the platform.
Capabilities Demonstrated
- Workflow mapping for complex technical systems
- Role-based monitoring and information design
- Data visibility and signal prioritization
- Cross-functional alignment with product, engineering, and data science
- Control-surface design for system health and risk states
- Platform thinking for machine learning operations